TURN YOUR DATA INTO VITAL INFORMATION
- Qualitative Data Analysis Help
- Content analysis. This refers to the process of grouping verbal/behavioural data to group, summarize and then tabulate the data.
- Narrative analysis. This method involves narrations given by respondents. It takes into account the context of the respondents and their different experiences. It is in essence, the revision of primary data collected by the researcher.
- Discourse analysis. A method of analysis of naturally occurring talk and all types of written text.
- Grounded theory. This method of qualitative data analysis starts with an analysis of a single case giving rise to evidence that help to develop a theory. Subsequently new cases are used to see if they can contribute to the theory.
- Quantitative Data Analysis Help
- Exploratory Data Analysis
- Multivariate Data Analysis
- Univariate Data Analysis and Statistical inferences
Statistical Packages use for analysis – SPSS, MINITAB, AMOS, Nvivo, Endnotes, SmartPLS
SOME COMMON QUANTITATIVE ANALYSIS TOPICS
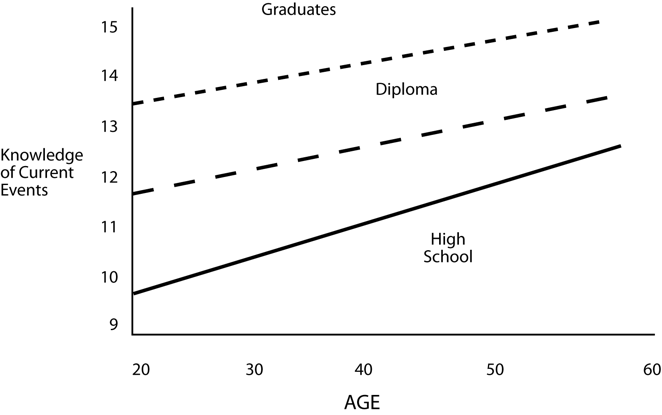
TOPIC 1 : ANALYSIS OF COVARIANCE (ANCOVA)
The Analysis of Covariance or also referred to as ANCOVA, is a powerful statistical procedure that is used in educational research to remove the effects of pre-existing individual differences among subjects in a study
WHAT IT DOES
ANCOVA reduces the error variance by removing the variance due to the relationship between age (covariate) and the dependent variable (knowledge of current events).
ANCOVA adjusts the means on the covariate for all of the groups, leading to the adjustment of the means of the dependent variable (knowledge of current events).
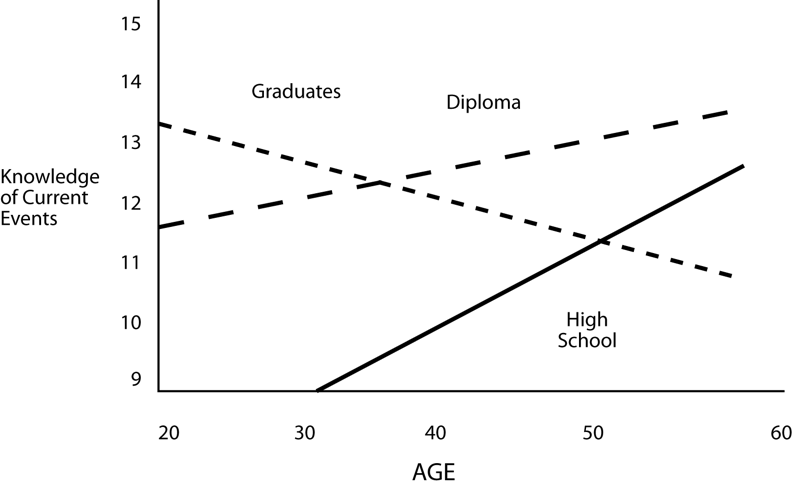
WHAT ARE ITS ASSUMPTIONS
- Normality
- Linearity
- Independence
- Homogeneity of Variance
- Homogeneity of Regression
- Reliability of the Covariate
SOME GENERATED SPSS PROCEDURE AND OUTPPUT
SPSS PROCEDURES TO OBTAIN SCATTER DIAGRAM & REGRESSION LINE FOR EACH GROUP
- Select Graphs then Scatter . If you’re using SPSS 16, then it is Graphs Legacy Dialog and then Scatter/Dot
- Make sure Simple is selected and then choose Define
- Move the dependent variable (i.e Knowledge of current events) to the Y Axis
- Move the grouping variable to Set Markers box
- Click OK
[Note that this will give you the scatter diagram of all the groups together]
- Once you have done the above , double-click on the Graph which opens up the SPSS Chart Editor
- Choose Chart and Options which opens the Scatter Plot Options
- Check on the Subgroups box
- Click on Fit Options button which opens the Fit Line dialogue box
- Click the Liner Regression and ensure the box is highlighted
- In Regression Prediction , check the Mean box
- Click on continue , then OK
[This will give you the regression on line of each of the groups separately]

TOPIC 2 : CORRELATIONAL STUDY
In general, a correlational study is a quantitative method of research in which you have TWO or more quantitative variables from the same group of subjects, & you are trying to determine if there is a relationship (or covariation) between the TWO variables . Theoretically, any TWO quantitative variables can be correlated (for example, midterm scores & number of body piercings!) as long as you have scores on these variables from the same participants; however, it is probably a waste of time to collect & analyze data when there is little reason to think these two variables would be related to each other.
Your hypothesis might be that there is a positive correlation (for example, the number of hours of study & your midterm exam scores), or a negative correlation (for example, your levels of stress & your exam scores). A perfect correlation would be an r = +1.0 & -1.0, while no correlation would be r = 0. Perfect correlations would almost never occur. Although correlation can’t prove a causal relationship, it can be used to support a theory, to measure test-retest reliability, etc.
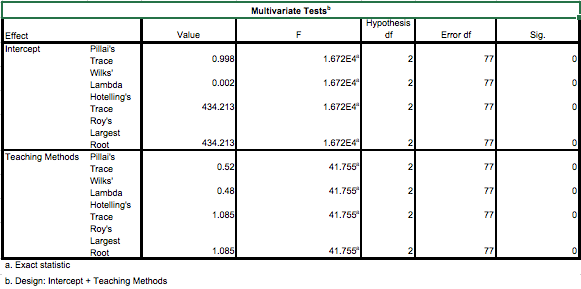
TOPIC 3 : MANOVA
MANOVA ia a multivariate procedures analogues of various univariate ANOVA experimental designs.
There are three variations of MANOVA:
- Hotelling’s T: Analogue of the two group T-test situation. Involves one dichotomous independent variable, and multiple dependent variables.
- One-Way MANOVA: Analogue of the one-way F situation. Involves one multi-level nominal independent variable, and multiple dependent variables.
- Factorial MANOVA: Analogue of the factorial ANOVA design. Involves multiple nominal independent variables, and multiple dependent variables.
Two major situations where MANOVA is used:
- There are several correlated dependent variables, and the researcher desires a single, overall statistical test on this set of variables instead of performing multiple individual tests.
- Exploring how independent variables influence some patterning of response on the dependent variables.

ASSUMPTION FOR MANOVA
Normal Distribution: – The dependent variable should be normally distributed within groups. Overall, the F test is robust to non-normality, if the non-normality is caused by skewness rather than by outliers. Tests for outliers should be run before performing a MANOVA, and outliers should be transformed or removed. For multivariate procedures, an important requirement is multivariate normal and the joint effect of the dependent variables is normally distributed. There is no direct test for multivariate normality as such it is necessary to provide evidence of univariate normality, even though this does not guarantee multivariate normality but data that complies to this requirement provide greater confidence.
WHAT ARE ITS ASSUMPTIONS
- Linearity
- Homogeneity of Variances
- Homogeneity of Variances and Covariances
SPECIAL CASES
Two special cases arise in MANOVA, the inclusion of within-subjects independent variables and unequal sample sizes in cells.
- Unequal sample sizes – As in ANOVA, when cells in a factorial MANOVA have different sample sizes, the sum of squares for effect plus error does not equal the total sum of squares. This causes tests of main effects and interactions to be correlated. SPSS offers adjustment for unequal sample sizes in MANOVA
- Within-subjects design – Problems arise if the researcher measures several different dependent variables on different occasions. This situation can be viewed as a within-subject independent variable with as many levels as occasions, or it can be viewed as separate dependent variables for each occasion.
SPSS PROCEDURES FOR ASSESSING
There are several procedures to obtain the different graphs and statistics to assess normality, for example the EXPLORE procedure is the most convenient when both graphs and statistics are required.
- From the main menu, select Analyse.
- Click Descriptive Statistics and then Explore ….to open the Explore dialogue box.
- Select the variable you require and click the arrow button to move this variable into the Dependent List: box.
- Click the Plots…command pushbutton to obtain the Explore: Plots sub dialogue box.
- Click the Histogram check box and the Normality plots with tests check box, and ensure that the Factor levels together radio button is selected in the Boxplots display.
- Click Continue.
- In the Display box, ensure that Both is activated.
- Click the Options…command pushbutton to open the Explore: Options sub-dialogue box.
- In the Missing Values box, click the Exclude cases pairwise (if not selected by default)
- Click Continue and then OK.
SPSS PROCEDURES FOR MANOVA
- Select the ANALYZE menu
- Click on the General Linear Model and then Multivariate … to open Multivariate dialogue box.
- Select the dependent variables and move them into the Dependent Variable box.
- Select the independent variable and move them into Fixed Factor box.
- Click on the Model … command pushbutton to open the Multivariate sub-dialogue box.
- In the Spesify Model box, ensure the Full Factorial radio button is selected and Type III is selected from the sum of squares : drop-down list.
- Click Continue
- Click on the Options… command pushbutton to open the Multivariate Options sub-dialogue box.
- In the Estimated Marginal Means box, under the heading Factors and Factor Interactions, click on the independent variable and move the variable into the Display Means for: box
- In the Display box, select the Descriptive statistics and Homogeity test check box